What This Article Actually Covers (And What It Doesn't)
Most "industrial robot market" articles online quote specific market share percentages, growth rates, and revenue forecasts as if they were established fact. This article takes a different approach. Rather than reproducing statistics that may be outdated by the time you read them, this guide focuses on three more durable things:
- Where to find real market data — the primary sources that publish methodology-disclosed installation statistics and manufacturer rankings.
- How to read manufacturer market positioning — what claims in vendor marketing materials actually mean, and how to evaluate them critically.
- The regulatory and economic framework that shapes 6-axis robot arm adoption in the USA and Canada — the factors that don't change year to year but determine feasibility for any installation.
We're taking this approach because unsourced statistics are common in this space, and it's easy to repeat a number that was already stale when it was first published. Any specific figure you see quoted online for "robot arm market share" is worth tracing back to its primary source before treating it as current fact.
Primary Sources for Market Data
When you need actual numbers — for an internal business case, a procurement justification, or academic research — these are the sources that publish their methodology alongside their data:
| Source | Type of Data | Geographic Coverage | Access |
|---|---|---|---|
| IFR World Robotics Report | Annual installation statistics, manufacturer rankings, regional distribution, application breakdowns | Global (90+ reporting countries) | Annual paid report; selected summary data published free |
| Manufacturer annual reports | Revenue, self-reported market share, product launches, regional service network | Company-specific | Public (investor relations, regulatory filings) |
| US Bureau of Labor Statistics (BLS) | Industrial automation employment trends, productivity data | USA (national and state-level) | Free |
| CSA Group / provincial economic agencies | Industrial automation investment data, manufacturing sector reports | Canada (provincial) | Mixed (some free, some paid) |
| Industry trade associations (A3, RIA) | North American robot sales statistics, application trends | North America | Mixed (selected reports free) |
A note about statistics in this article: The IFR updates installation rankings annually, and prior-year figures are revised as reporting countries submit updated data. Any specific market-share figure cited in a third-party article should be checked against the IFR's most recent publication directly. We deliberately don't reproduce specific market-share percentages here, because that data requires access to the current IFR report and shifts from one edition to the next.
How to Read Manufacturer Market Positioning
When evaluating suppliers — FANUC, ABB, KUKA, Universal Robots, Standard Bots, Yaskawa, Kawasaki, Epson, and others — vendor marketing materials tend to use a consistent set of positioning claims. Learning to read these claims critically is more useful than memorizing any single statistic.
Common Marketing Claims and What They Mean
- "Market leader" or "#1 in [category]": Always check the source. Some manufacturers claim leadership in a narrow sub-category (e.g., "number one in arc welding robots") that doesn't represent overall market share. IFR rankings are typically based on units installed, not revenue — a different methodology can produce a different "leader."
- "Fastest-growing" claims: Growth rate depends heavily on the baseline year. A company growing from a small base can show a high percentage growth rate while still holding a small absolute market share. Look for both the percentage and the absolute number.
- "Largest installed base": This favors manufacturers with long histories in a region and may not reflect current momentum or product capability.
- "Industry-leading repeatability of ±0.02mm": This is a real, checkable specification, but it should be compared under identical test conditions (ISO 9283 is the relevant standard for repeatability testing). Marketing materials sometimes quote best-case numbers from controlled laboratory conditions.
- "Open ecosystem" vs. "integrated solution": Open-ecosystem claims usually mean compatibility with third-party software (ROS, Python, PLCs via EtherCAT/PROFINET). Integrated solutions emphasize turnkey deployment but can lock customers into proprietary tooling.
Manufacturer Strategic Positioning
Rather than reproducing market-share percentages we can't verify at the time of writing, this section describes how each major manufacturer is generally positioned in the North American market, based on publicly known business focus areas and product-line characteristics — not market-share claims.
| Manufacturer | Strategic Focus | Primary Use Cases | Typical Buyer Profile |
|---|---|---|---|
| FANUC | High-volume industrial production; extensive certified service network in North America | Welding, material handling, CNC machine tending, painting | Mid-to-large manufacturers with high-duty-cycle production needs |
| ABB Robotics | Global industrial focus, with strength in automotive and electronics | Welding, assembly, painting, palletizing | Automotive suppliers, large-scale manufacturing operations |
| KUKA | Heavy payload and automotive integration, German engineering heritage | Heavy-duty welding, automotive body shop, foundry applications | Automotive OEMs, heavy industry |
| Universal Robots | Widely credited with establishing the collaborative robot (cobot) category | Machine tending, light assembly, lab automation, education | SMEs entering automation, flexible production environments |
| Yaskawa (Motoman) | Industrial arc welding specialist; strong presence in North American automotive and metal fabrication | Arc welding, material handling, assembly | Metal fabrication shops, automotive tier suppliers |
| Standard Bots | US-based manufacturer focused on desktop and mid-payload industrial systems; markets a domestic supply chain | CNC tending, light assembly, machine loading, education | US manufacturers prioritizing domestic support and faster delivery |
| Kawasaki Robotics | Diversified industrial and collaborative product lines; presence in food/packaging and semiconductor | Pick-and-place, semiconductor handling, food packaging | Specialty manufacturing, food and pharmaceutical industries |
Regional Adoption Patterns in the USA and Canada
Robot installation density in North America tends to follow manufacturing concentration. The states and provinces most often cited for high robot density are also the ones with established automotive, aerospace, and heavy manufacturing sectors, often supported by state or provincial economic development programs.
USA Regional Adoption
Per IFR regional data, the US Midwest and Southeast have typically led in industrial robot installations. States frequently cited for high robot density include:
- Michigan — automotive supply chain, including legacy automakers and EV battery facilities
- Ohio — diversified manufacturing, automotive components, aerospace
- Indiana — heavy industry, automotive assembly
- Tennessee — automotive assembly plants, EV battery production
- Georgia — manufacturing growth corridor with state-level automation incentives
- South Carolina and North Carolina — automotive and aerospace-adjacent manufacturing
For specific state-level installation counts, the IFR's World Robotics Report includes regional breakdowns, and individual state economic development agencies often publish local data. The Association for Advancing Automation (A3) also publishes North American robot sales statistics.
Canada Regional Adoption
Ontario and Quebec have typically led Canadian robot installations, associated with:
- Ontario — automotive assembly corridor, EV battery production, food processing
- Quebec — aerospace manufacturing, pharmaceutical and food processing, growing EV battery investment
- British Columbia — forestry equipment manufacturing, growing tech manufacturing
- Alberta — emerging automation in food processing and oilfield equipment
Provincial economic development agencies (Invest Ontario, Investissement Québec) publish investment-attraction data that includes automation-related capital spending. Provincial occupational health and safety codes also vary in how they implement CSA Z434 requirements, which can affect installation design.
Regulatory Framework: What Every Buyer Must Address
Unlike market data, the regulatory framework for robot installations is stable and well-defined. Every 6-axis robot arm installation in the USA and Canada must comply with applicable safety standards before commissioning.
| Standard | Jurisdiction | Scope | Authority |
|---|---|---|---|
| ISO 10218-1 | International | Safety requirements for industrial robots — design and integration | ISO (foundation for regional standards) |
| ISO 10218-2 | International | Integration and installation safety requirements | ISO |
| ISO/TS 15066 | International | Collaborative robot-specific guidance (force limits, speed limits, biomechanical limits) | ISO Technical Specification |
| ANSI RIA R15.06 | USA | National adoption of ISO 10218 with US-specific risk assessment and safeguarding requirements | ANSI / Association for Advancing Automation (A3) |
| CSA Z434 | Canada | National adoption of ISO 10218 with Canadian-specific requirements and provincial harmonization | CSA Group |
| NFPA 79 (Electrical) | USA | Electrical safety for industrial machinery, including robot cells | NFPA |
| CSA C22.1 (Canadian Electrical Code) | Canada | Electrical installation requirements for industrial equipment | CSA / Provincial adoption |
| Provincial/state OHS codes | Sub-national | Worker safety requirements that may add specific installation or operator training requirements | OSHA (US federal/state), provincial OHS agencies (Canada) |
Practical implication for buyers: The risk-assessment process defined in ANSI RIA R15.06 and CSA Z434 is the same in structure for every installation. A documented risk assessment must identify hazards, estimate risk, and implement appropriate risk-reduction measures before any robot is commissioned. For collaborative robot installations, ISO/TS 15066 provides the specific biomechanical limits (force, pressure, speed) that must not be exceeded in collaborative operation.
How Market Trends Affect Buyer Decisions (Without False Precision)
Some market trends affect how you should plan a 6-axis robot arm purchase, even when the exact numbers vary by report. Rather than claiming a specific growth rate we can't verify, here are the directional trends that are consistently reported across multiple sources:
Directional Trends to Understand
- Collaborative robot adoption has been increasing as a share of total installations, particularly in SMEs and flexible production environments. The exact percentage varies by report, but the direction is consistent across IFR, A3, and industry analyst data.
- Average industrial robot prices have been gradually declining in real (inflation-adjusted) terms, driven by scale, competition, and modular component standardization. Total cost of ownership hasn't declined at the same rate, because integration, programming, and maintenance costs remain substantial.
- Software ecosystem matters more than hardware specifications alone. Robots that support open standards (ROS 2, OPC UA, EtherCAT, MQTT) tend to integrate more flexibly into modern factory architectures than closed-ecosystem alternatives.
- Service network and parts availability increasingly differentiate suppliers. A robot with slightly lower specifications but a strong regional service network often carries lower lifetime risk than a higher-spec robot from a manufacturer with limited local support.
- AI and vision integration is becoming more common in higher-end offerings. Buyers planning multi-year automation investments should ask about the supplier's roadmap, not just current capabilities.
The most reliable way to evaluate a robot arm supplier isn't the market-share figure in their marketing deck — it's the documented support infrastructure and local service technician availability in your region.
Strategic Buyer Recommendations
Based on the regulatory framework, manufacturer positioning, and regional adoption patterns above, here is a structured evaluation process for buyers in the USA and Canada:
- Define the application first, not the supplier: Payload, reach, repeatability, cycle time, and environment should drive the selection. A clear specification eliminates most of the candidate list before any vendor-specific marketing enters the discussion.
- Verify the supplier's regional service presence: Confirm certified technicians, response-time SLAs, and spare-parts inventory within your geography. A robot without local service becomes a liability after the warranty period.
- Request a documented risk assessment from the supplier or an independent integrator. ANSI RIA R15.06 / CSA Z434 compliance is not optional, and any supplier that doesn't address this in their proposal is signaling a possible regulatory gap later.
- Calculate total cost of ownership over 5–10 years, not just purchase price. Include integration, training, preventive maintenance, spare parts, energy, downtime, and end-of-life disposal.
- Confirm standards and certification: Verify the specific robot model is certified to the current ANSI RIA R15.06 or CSA Z434 edition, and that any collaborative features meet ISO/TS 15066 limits.
- Check the technology roadmap: Software support lifecycles typically outlast hardware. Confirm the supplier has a published roadmap for controller updates, security patches, and feature releases.
Related Resources
For deeper analysis on specific aspects of 6-axis robot arm selection, implementation, and operation:
- Arduino Robot Arm Tutorial — 6-DOF Build Guide
- ROS 2 Control Framework for Robot Arms
- Open-Source STL Files for 3D-Printed Robot Arm Components
- Robot Arm ROI Calculator: Payback Period & Cost Savings Guide
- 6-Axis Robot Arm Maintenance Schedule
For a full comparison of specific robot arm models — not just manufacturer strategy — see our 6-DOF Robot Arm Guide.
Sources and References
The claims in this article are traceable to the sources below. Specific market-share figures, growth rates, and regional installation data should be verified against the most current IFR publication directly, since this article intentionally does not reproduce numbers that go stale between report editions.
- International Federation of Robotics (IFR) — World Robotics Report (annual), the standard reference for global installation statistics, manufacturer rankings, and regional distribution. Selected summary data is published free; the full report is paid.
- ANSI RIA R15.06 — US industrial robot safety standard, administered by the Association for Advancing Automation (A3).
- CSA Z434 — Canadian industrial robot safety standard, published by CSA Group.
- ISO 10218-1, ISO 10218-2, ISO/TS 15066 — International robot safety standards available through ISO.
- Manufacturer specifications and annual reports: FANUC, ABB, KUKA, Universal Robots, Yaskawa, Standard Bots, Kawasaki Robotics.
- US Bureau of Labor Statistics — Industrial automation productivity and employment data (free public access).
Frequently Asked Questions
Where can I find reliable 6-axis robot arm market statistics?
The most widely cited source is the IFR World Robotics Report, published annually at ifr.org/world-robotics. The IFR aggregates installation data from over 90 countries and is a standard reference for academic, industry, and government research. Manufacturer annual reports and the Association for Advancing Automation (A3) provide additional North American context.
What is the difference between a 6-axis industrial robot and a collaborative robot?
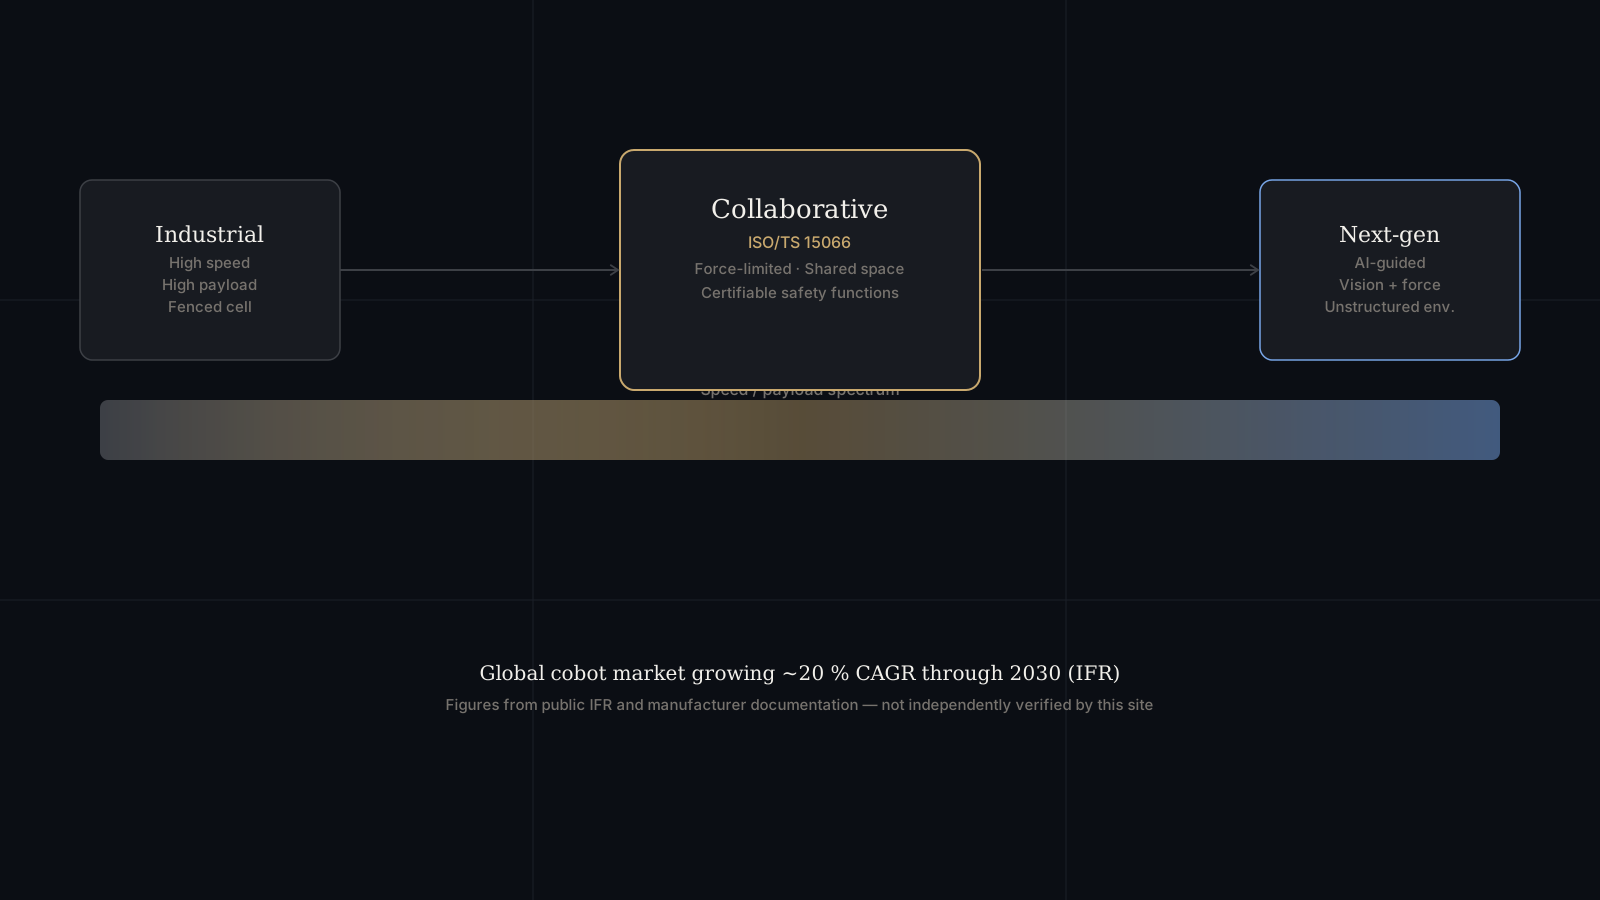
Traditional 6-axis industrial robots are designed for high-speed, high-payload tasks and typically require safety enclosures, light curtains, or area scanners. Collaborative robots (cobots) have built-in force and speed limitations that allow them to work near humans without external safety barriers, though a documented risk assessment is still required. Both types commonly have 6 axes but differ significantly in payload, speed, and integration requirements.
Which US states have historically had high 6-axis robot installation rates?
Based on IFR regional data and state economic development reports, the US Midwest (Michigan, Ohio, Indiana, Illinois) and Southeast (Tennessee, Georgia, South Carolina, North Carolina) have typically led in industrial robot installations, driven by automotive supply chains and manufacturing incentives. For current-year figures, consult the most recent IFR World Robotics Report directly.
What safety standards apply to robot arm installations in the US and Canada?
In the US, ANSI RIA R15.06 is the primary standard for industrial robot safety, aligned with ISO 10218-1 and 10218-2. In Canada, CSA Z434 is the equivalent national standard. Both require documented risk assessments, appropriate safeguarding, and adherence to provincial or state occupational health codes.